How to Find Your Shopify Conversion Rate (Step-by-Step Guide)
")
Conversion rate is one of the most important e-commerce metrics. Because there’s no point driving a ton of visitors to your site if none of them buys anything.
A strong conversion rate is a sign of a healthy Shopify store. Particularly in terms of your:
- Store navigation
- Promotions and discounts
- Checkout process
- Products
- Pricing
…and much more besides.
So we’re agreed: conversion rate matters.
Now, let’s get into how to find your Shopify store’s conversion rate…
How to Find Your Shopify Store’s Overall Conversion Rate
Finding your store’s overall conversion rate is super simple. Just follow these steps:
- Log in to your Shopify admin.
- In the left-hand menu, click Analytics.

- From the main Analytics page, you can get a top-level view of your online store’s conversion rate for the current day compared to the previous day (depending on your screen size, you might have to scroll down to view this report).

- To view conversion rate for a different period, click Today at the top of the page, then choose your desired timeframe (e.g. yesterday, last month, etc).

- To compare your conversion rate against a different period – or, alternatively, to deactivate the comparison view – click Compare to: Yesterday at the top of the screen and choose your preferred option.

- For a more in-depth view, click Conversion rate over time to bring up the dedicated report page…

- …where you can find data like the number of customers who have added to cart, reached checkout, and completed the checkout process.

Incidentally, this isn’t the only conversion rate data you can find in Shopify.
If you’re using the Shopify Search & Discovery app to add manual and/or automated product recommendations to your store’s product pages, you can also see how well those recommendations are converting.
Pro tip: We named Search & Discovery as one of our favorite Shopify apps for upselling. For more recommendations, check out Best Shopify Upsell Apps.
Here’s how to find this information:
- Log in to your Shopify admin.
- In the left-hand menu, click Analytics > Reports.

- Use the search box at the top of the page to search for Product recommendation conversions over time, then click the relevant report.

- Use the options at the top of the report page to edit the time period you’re viewing, the period you’re comparing against, and the frequency of data points displayed (daily, weekly, monthly, etc).

This is useful because it tells you whether shoppers are interested in the products you’re recommending, and whether you’re giving them a compelling reason to purchase multiple items at once (like offering a free shipping threshold or “buy X, get Y” discount).
Pro tip: Learn more about product recommendations in How to Cross-Sell on Shopify: Expert Tips & Strategies.
How to Find Conversion Rates By Product
Unfortunately, Shopify doesn’t let you break down conversion rates by individual products 😔
But it’s not all bad news.
For starters, Shopify’s built-in analytics lets you view lots of other product-related metrics, such as:
- Sell-through rate by product: Measures the percentage of a product’s inventory sold within a set period relative to the amount of inventory received. A high sell-through rate suggests the product is converting at a high rate.
- ABC analysis by product: Groups products into three categories – from high-profit, high-demand (“A”) to low-profit, low-demand (“C”). A-class products are in highest demand, indicating higher conversion rates.
- Profit/sales by product: Simply put, the total profit or sales volume generated by each product over a set period. If a product is selling well, it probably has a decent conversion rate.
You can find all those reports by navigating to Analytics > Reports in your Shopify admin.

And if those metrics don’t do the job, the Shopify App Store contains plenty of reporting and analytics tools offering more advanced/granular e-commerce data (we’ll share our favorites later in this article).
4 Ways to Interpret Conversion Rate Data
Data doesn’t mean much in isolation.
Like, sure, Shopify might tell you that your conversion rate is 2.5%. But what are you meant to do with that information? Is it good? Bad? Indifferent?
With that in mind, let’s look at some of the ways to add all-important context to your conversion rate data…
Consider Industry Benchmarks
One obvious approach is to compare your store’s conversion rate against industry benchmarks.
For instance, Dynamic Yield shares average conversion rate data across eight industries, based on analysis spanning 200 million unique users and 300 million total sessions:

- Home & furniture: 1.24%
- Multi-brand retail: 4.23%
- Luxury & jewelry: 1.19%
- Beauty & personal care: 4.74%
- Food & beverage: 5.93%
- Pet care & veterinary services: 3.01%
- Consumer goods: 3.61%
- Fashion, accessories & apparel: 3.28%
Of course, this approach isn’t exactly foolproof.
For one thing, data like this rarely spans every industry. And even if it does cover your industry, it doesn’t factor in sub-niches. A premium streetwear brand might see very different conversion rates to a budget outdoor clothing retailer, but they’d both be listed under “fashion, accessories, and apparel”.
Still, these benchmarks can at least give you an idea of how your conversion rate stacks up against the competition.
Monitor Conversion Rate Trends Over Time
We’ve already noted how Shopify lets you view conversion rate data for a single day, a full year, or even multiple years.
Zoom out over longer periods to see how seasonality affects your conversion rate. Are your visitors more likely to buy in peak shopping periods like the holiday season? Or perhaps customers are more likely to shop around at these times, meaning you actually see higher conversion rates during quieter times.
Helpfully, Shopify also lets you track your conversion rate across the most important shopping period of all – Black Friday and Cyber Monday.

You can even use this view to compare conversion rates across previous Cyber Weekends, helping you understand which offers and promotions resonated with your audience.
Compare Conversion Rates Across Audience Segments
Your store almost certainly serves more than one “type” of customer. For instance, a yoga brand’s website visitors might include:
- Yoga experts
- First-timers who are just getting into yoga
- People searching for gifts for the yoga lover in their life
And then you’ve got new customers, repeat buyers, VIPs… the list goes on.
Chances are there’s some variance in conversion rate between those audience segments. For instance, we’d expect returning customers to convert at a higher rate than newcomers because they already know what to expect from your products (and, presumably, they must like their previous purchase if they’re considering buying again).
Analyzing your conversion rate by audience segment helps you understand whether your brand, products, and promotions are resonating with each group.
It can also help you measure the effectiveness of campaigns targeting specific segments – like a 10% discount for new customers.
Pro tip: Shopify’s built-in analytics tools don’t let you view conversion rate data by audience segment – you’ll need a third-party tool to do this. We’ve recommended five of the best options later in this article…

Learn How to Double (2X) Your Shopify Sales with Product Labels
-
Boost sales by highlighting key features with product badges
-
Increase conversions by promoting scarcity, urgency and social proof
-
Sell more with targeted promotions to increase average order sizes
Analyze Conversion Rate Across Your Sales Funnel
You should also look at how your conversion rate varies across the different steps in your sales funnel.
For instance, here’s a sample analysis of a top-level conversion funnel from Bloomreach, spanning the start of a website session to the point of purchase:

The above analysis tells us that if 1,000 visitors enter the site…
👉 443 will view an item
👉 79 will add an item to their shopping cart
👉 46 will actually buy something
…for an overall conversion rate of 4.6%.
Judging by our industry benchmarks, that sounds pretty solid. But there’s definitely room for improvement, with our conversion funnel showing that over 40% of people who add-to-cart don’t end up buying.
This suggests the sample store should focus on improving their cart abandonment rate.
⚠️ Disclaimer: Again, you can’t run this sort of advanced conversion rate analysis using Shopify’s default analytics tools.
Additional Tools & Apps for Tracking Shopify Conversion Rates
You can use Shopify’s built-in analytics to access basic conversion rate data.
But for more advanced insights, you’ll want to look at a dedicated analytics and reporting tool.
Here are five of the best Shopify-specific options, based on review scores from real-world Shopify merchants…
| App | Price | App Store Rating |
| TP: True Profit Analytics | From $35 per month | 5/5 (from 747 reviews) |
| Report Pundit: Custom Reports | Free plan available | 4.9/5 (from 1,769 reviews) |
| BR – Better Reports | From $19.90 per month | 4.9/5 (from 1,184 reviews) |
| Data Export IO: Reports | Free plan available | 5/5 (from 2,327 reviews) |
| Mipler – Advanced Reports | Free plan available | 5/5 (from 484 reviews) |
TP: True Profit Analytics

Key Features
- View your store’s true net profit in the real-time profit dashboard.
- Sync ad spend from Facebook, Google, TikTok, Bing, Snapchat, and Amazon in real time.
- Access product-level and ad-level net profit data.
Pricing
From $35 per month for up to 300 orders per month. All plans include a 14-day free trial.
Report Pundit: Custom Reports

Key Features
- Generate instant insights from 120+ pre-built reports.
- Build custom reports based on 2,000+ data fields, including filtering, sorting, and formatting.
- Leverage data from tags, metafields, and line-item properties.
Pricing
Free for stores with <1,000 lifetime orders. Paid plans start at $9 per month for stores on the Shopify Basic plan. All paid plans include a 14-day free trial.
BR – Better Reports

Key Features
- Access data on your store’s sales, payments, inventory, customers, payouts, and more.
- Use custom fields, metrics, and formulas to dive deeper into your data.
- Export reports to PDF, Excel, CSV, and Google Sheets.
Pricing
From $19.90 per month for Shopify Basic stores. All plans include a 14-day free trial.
Data Export IO: Reports

Key Features
- Access 100+ pre-created reports covering sales, inventory, customers, and more.
- Filter data based on values, text, dates, and more.
- Add password protection to reports to limit access.
Pricing
Free for stores with fewer than 1,000 lifetime orders. Paid plans start at $7 per month for Shopify Basic stores. All paid plans include a 15-day free trial.
Mipler – Advanced Reports

Key Features
- View data from 126 pre-built reports covering sales, customers, inventory, and more.
- Merge data from multiple stores into one report.
- Share reports using public links, with no need for access to your Shopify admin.
Pricing
Free for stores with <1,000 lifetime orders. Paid tiers start at $14.99 for stores on the Shopify Basic plan. All paid plans include a seven-day free trial.
BONUS TIP: Boost Conversion Rates With Product Badges

Want to boost your store’s overall conversion rate?
Or maybe you’ve discovered that specific products or promotions aren’t converting as you’d hope?
Either way, product badges can help you turn more website visitors into paying customers. For instance, you can…
- Leverage the power of social proof by tagging products as “best sellers”
- Drive urgency and scarcity by highlighting products with low stock levels
- Boost underperforming products with badges like “Special Offer” and “Bundle & Save”
- Get more eyes on your most attractive promotions by adding “Free Shipping” or “X% Off” badges
…and that’s just for starters.
It’s all about steering people toward your best products and promotions. And the easier it is for shoppers to find those star deals, the more likely they are to buy.
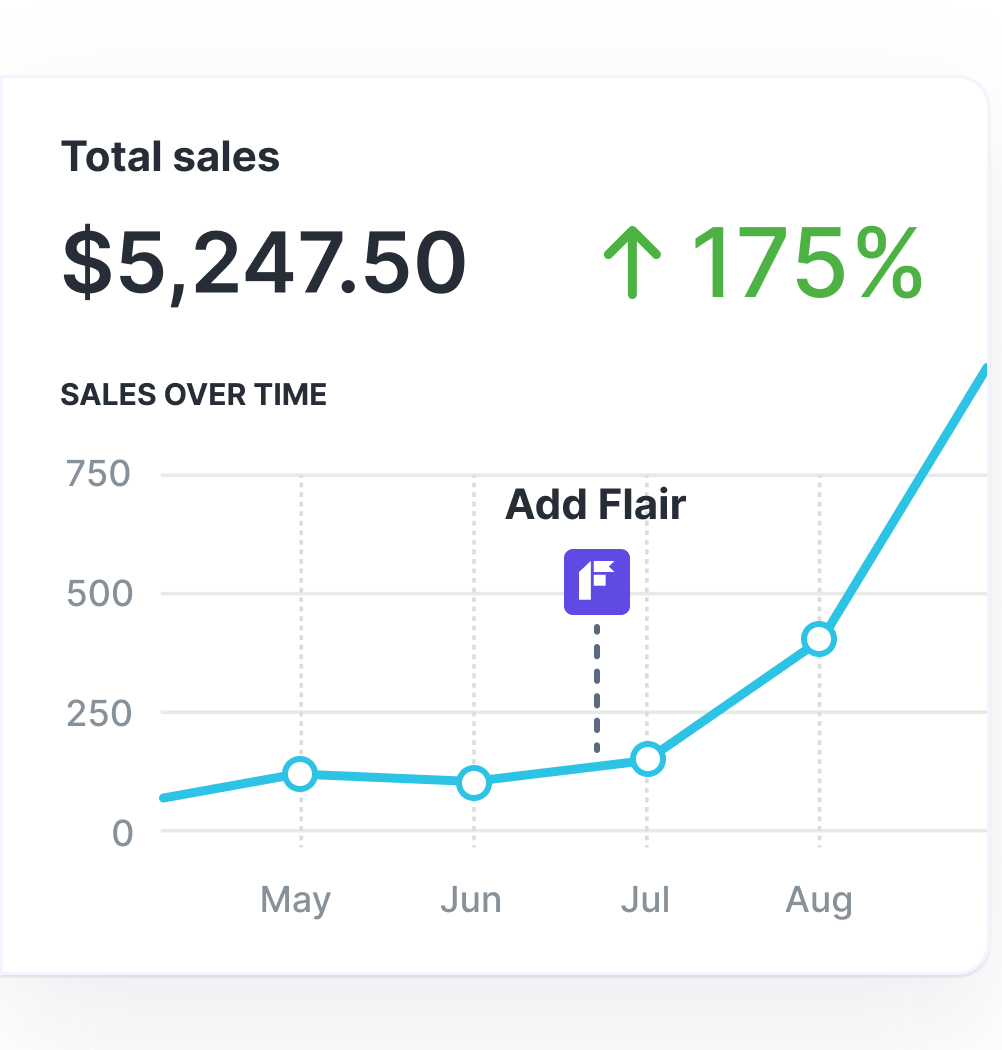
Grow Your Shopify Sales by over 175% with Flair
-
Increase sales using product badges and sales banners
-
Maximize conversions with scarcity, urgency and countdown timers
-
Automate promotions with targeted rules and scheduling
FAQs
How do you calculate conversion rate?
Calculate your store’s conversion rate using the following formula:
Online store conversion rate = [converted sessions / all sessions] × 100
So if your store generated 20,000 total sessions in January, with 750 of them resulting in a conversion, your conversion rate for the month would be 3.75%.
How do you track conversions in Shopify?
To track conversions in Shopify, simply log in to your Shopify admin and click Orders. From this screen, you’ll see a list of all your store’s orders covering either the current day, the last seven days, or the last 30 days.
What is the average Shopify conversion rate?
The average conversion rate for Shopify was 1.4%, according to an analysis of 2,800 stores from Littledata. However, this varies by industry. For instance, travel e-commerce sites see an average conversion rate of just 0.2%, rising to 1.9% for fashion e-commerce stores.
What is a good conversion rate for Shopify stores?
A conversion rate of 3.2%+ would put you in the top 20% of Shopify stores, according to Littledata, while the top 10% of stores see conversion rates of 4.7%+.