26+ E-Commerce Statistics for 2025: New Data & Consumer Trends

The Future of E-Commerce: A Global Shift You Can’t Ignore
The digital world is transforming faster than ever, and nowhere is this more apparent than in e-commerce. Whether you’re an online retailer, curious consumer, or industry analyst, keeping up with these changes is crucial to staying competitive. E-commerce isn’t just about online shopping anymore — it’s a major player in the global economy, driving innovation and reshaping consumer behavior. As the industry evolves, so does the need for robust e-commerce website development, which plays a pivotal role in maintaining a competitive edge.
In this article, we dive into the latest e-commerce statistics for 2025, covering everything from mobile and social commerce to regional growth trends and holiday shopping habits. Ready to see how these stats can shape your strategy? Let’s get into it!
Pro Tip: For more e-commerce trends, check out our related guide: Top Ecommerce Trends - What Online Retails Need to Know Now.
Global E-Commerce: Growth You Can’t Afford to Ignore
The rise of e-commerce is undeniable. There are currently more than 27 million e-commerce websites worldwide [1], with 52% of those based in the US alone [2]. And it’s only going to grow bigger. Between 2019 and 2023, the number of e-commerce sites tripled [2:1], reflecting the significant shift to digital shopping. By 2027, e-commerce will account for nearly one-quarter of global retail sales, making it a $7+ trillion industry by 2025 [3].
For business owners and entrepreneurs, this growth represents a massive opportunity. Now is the time to capture market share and innovate in a space that’s constantly evolving.
Mobile Commerce: The New Normal
Headline Statistics:
- Mobile e-commerce sales hit $1.7 trillion in 2023 [4].
- By 2028, two-thirds of all online purchases will happen via mobile [4:1].
Five years ago, completing a purchase on your phone was a novelty. Fast-forward to 2024, and mobile commerce — or m-commerce — is the new frontier. In fact, mobile shopping is projected to account for 57% of all e-commerce sales this year [4:2].
But with convenience comes challenges. Despite making up 77% of global retail traffic [5], mobile still sees the highest cart abandonment rate of any device, with 85% of carts left behind in the US [6].

Still, the trend is clear: mobile shopping is the future, and retailers who optimize for mobile will come out on top
Mobile Commerce in the US: A Youth-Driven Phenomenon
In the US, mobile commerce is even more prominent among younger consumers. About 73% of Americans use their smartphones to browse and purchase [7], with the 18-24 age group leading the charge at 75% [8]. By 2027, US mobile commerce sales are expected to hit $856 billion [9], and the share of mobile-driven purchases will only continue to grow.
And while m-commerce dominates everyday shopping, its influence is especially visible during the holiday season. On Christmas Day alone in 2023, mobile accounted for 63% of online purchases in the US [10]. Retailers must keep this shift in mind as they prepare for future holiday sales.

Learn How to Double (2X) Your Shopify Sales with Product Labels
-
Boost sales by highlighting key features with product badges
-
Increase conversions by promoting scarcity, urgency and social proof
-
Sell more with targeted promotions to increase average order sizes
Social Commerce: The Next Big Thing in Shopping
Headline Statistics:
- Social commerce will drive one in five online sales by 2025 [11].
- Global social commerce revenues are expected to hit nearly $700 billion in 2024 [12].
Picture this: You’re scrolling through Instagram, and a limited-time offer for a product pops up in your feed. With just a tap, you’ve made a purchase. Social commerce — shopping via social media platforms — is now embedded in our everyday lives.
The numbers tell a compelling story: 18.5% of global e-commerce sales in 2023 came from social commerce [12:1], and by 2027, the US alone will see revenues rise to $141 billion [13]. Facebook is leading the pack, with 20.6% of US social buyers making purchases on the platform [14], followed by Instagram and YouTube.

For brands, social commerce represents a key opportunity to engage customers directly in the spaces they already spend time. This shift highlights the importance of social media not just as a marketing tool but as a direct sales channel.
E-Commerce Holiday Trends: The Power of Seasonality
Headline Statistics:
- US consumers spent $222.1 billion online during the 2023 holiday season [15].
- Holiday sales are expected to reach $280 billion in 2024 [16].
While every month is important in e-commerce, the holiday season reigns supreme. During the final two months of 2023, consumers spent an average of $2.95 per shopping session online [17]. Electronics dominated Black Friday, with 78% of men planning to buy in this category [18], but clothing and accessories remained top for women [18:1].
Interestingly, the holiday shopping season seems to be starting earlier each year. In 2023, 34% of US consumers started their holiday shopping before Thanksgiving [19], and 16% began as early as June [19:1]. This shift means that retailers must rethink traditional timelines for promotions, pushing campaigns earlier to capture these early-bird shoppers.
The Future of Fulfillment: Speed and Convenience Rule
In today’s fast-paced world, consumers expect speed — and that extends to shipping. In 2024, demand for same-day delivery is expected to grow by 20% [20], with 68% of shoppers citing faster delivery options as the biggest factor influencing their purchase decisions [20:1].
For e-commerce retailers, this means investing in logistics and fulfillment options that meet the growing consumer appetite for convenience. It’s not just about offering products anymore — it’s about delivering them quickly and seamlessly.
Regional Powerhouses: The Global Leaders in E-Commerce
Headline Statistics:
- Asia leads global e-commerce, with revenues surpassing $1.7 trillion in 2023 [21].
- China is expected to surpass $2 trillion in online sales by 2027 [22].
- The US e-commerce market is expected to reach $1.9 trillion by 2029 [23].
While the US and China dominate the global e-commerce landscape, other regions are experiencing rapid growth. India’s e-commerce market, for example, is projected to grow at a compound annual growth rate (CAGR) of over 14% between 2023 and 2027, making it one of the fastest-growing markets worldwide [21:1].
In countries like Thailand and Colombia, social commerce adoption is even higher than in China, with over 90% of consumers in both countries making purchases through social networks [24].

This reflects the global nature of e-commerce growth — and the importance of adapting to local preferences.
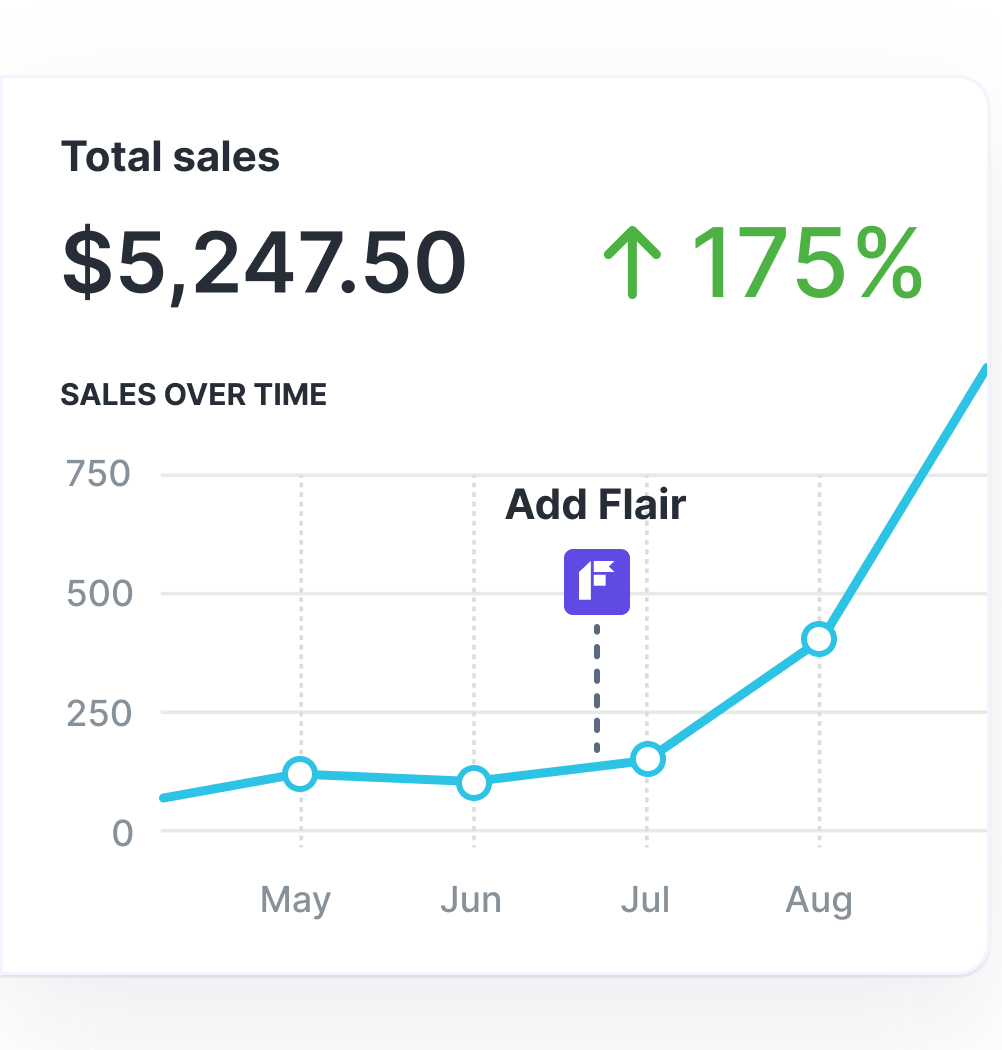
Grow Your Shopify Sales by over 175% with Flair
-
Increase sales using product badges and sales banners
-
Maximize conversions with scarcity, urgency and countdown timers
-
Automate promotions with targeted rules and scheduling
The Bottom Line: What These Stats Mean for You
E-commerce is a fast-evolving space where opportunity abounds. Whether it’s the continued rise of mobile shopping, the growing importance of social commerce, or the influence of holiday trends, one thing is clear: staying ahead of the curve is essential for success.
Consider that 81% of Americans now shop online [25], and the number of online shoppers is expected to reach 333.5 million by 2029 [26]. With the digital marketplace only growing, now is the perfect time to capitalize on these trends and future-proof your business.
If you’re thinking of launching your first online store, now is the time. Start by choosing a platform that’s optimized for mobile, allows seamless integration with social media, and can scale with you as your business grows. Shopify, for example, offers all this and more.
Pro Tip: If you’re ready get started on your e-commerce journey, check out our guide: How Does Shopify Work & What Is It?.
References
How Many Websites Are There in the World? (2024) - Siteefy ↩︎
Global: m-commerce revenue and share in e-commerce 2017-2028 | Statista ↩︎ ↩︎ ↩︎
Global retail site device visit & order share 2024 | Statista ↩︎
Most common devices for online purchases in the U.S. 2023 ↩︎
U.S. e-commerce shopper mobile audience by age 2023 | Statista ↩︎
Media Alert: Adobe: Holiday Shopping Season Drove a Record $222.1 Billion Online ↩︎
Share of social commerce buyers worldwide 2023, by country ↩︎
Global social commerce share of online retail 2018-2028 | Statista ↩︎ ↩︎
Most popular social commerce platforms among digital buyers in the United States in 2023 ↩︎
Media Alert: Adobe: Holiday Shopping Season Drove a Record $222.1 Billion Online ↩︎
US: holiday season retail sales forecast by channel 2024 | Statista ↩︎
United States: products to buy online on Black Friday or Cyber Monday 2023 | Statista ↩︎ ↩︎
Holiday Shopping Preview: Shoppers Planning to Start Even Earlier This Year - CivicScience ↩︎ ↩︎
5 Delivery statistics you need to know for 2024 | Roadie ↩︎ ↩︎
Global: e-commerce retail sales CAGR 2024-2029 | Statista ↩︎
https://www.statista.com/statistics/1252481/social-buyers-worldwide-countries/ ↩︎
Report: Smartphones account for 73% of online orders in the U.S. ↩︎